Global Logistics Update
U.S.-China Tariff Truce Continues; Volcanic Eruption Disrupts North Pacific Air Routes
North America vessel dwell times and other updates from the global supply chain | May 17, 2023
Global Logistics Update: August 14, 2025


Trends to Watch
Talking Tariffs
- President Trump Extends Temporary U.S.-China Tariff Agreement: On August 11, President Trump signed an executive order extending the temporary trade deal between the U.S. and China for another 90 days.
- The temporary agreement, which took effect on May 14, was initially due to expire on August 12.
- Until November 10, 2025, the duty rates under the temporary agreement will remain in effect: a 30% tariff on Chinese goods imported into the U.S., and a 10% tariff on U.S. goods imported into China.
- The order came two weeks after the latest round of U.S.-China trade talks. For the time being, the extension will prevent tariffs from reverting back to pre-truce levels.
- The Latest on International Emergency Economic Powers Act (IEEPA) Tariff Litigation: On August 11, Solicitor General D. John Sauer and Assistant Attorney General Brett Shumate submitted a letter to the U.S. Court of Appeals for the Federal Circuit. A ruling against President Trump’s IEEPA tariffs would result in “catastrophic consequences for national security, foreign policy, and economy,” they argued.
- Sauer and Shumate cited President Trump’s recently brokered trade agreements, including “the largest trade agreement in history” involving the EU.
- The federal appeals court will determine whether to uphold the Court of International Trade (CIT)’s invalidation of President Trump’s IEEPA tariffs, after issuing a temporary stay that has kept the duties in place.
- The federal appeals court heard oral arguments on July 31, and may take several months to reach a ruling. The case will likely be appealed to the U.S. Supreme Court.
- Other Recent Tariff Developments:
- Last week, President Trump announced plans to impose a potential 100% duty on semiconductors, along with possible pharmaceutical levies. He has not provided any further details.
- President Trump’s modified country-specific reciprocal tariffs took effect on August 7. Any nation not listed in President Trump’s July 31 executive order is subject to a 10% baseline reciprocal tariff, with the exception of China and Canada. Check out our live blog for more, including details on reciprocal in-transit exception eligibility and transshipments.
- Indian goods imported into the U.S. will be subject to an additional 25% blanket duty beginning August 27, on top of a 25% reciprocal tariff that took effect on August 7. This means that the effective duty rate on some Indian-origin goods will be 50%, depending on shipment departure and arrival dates. Visit our live blog for a breakdown of applicable duties.
- IEEPA “fentanyl” tariffs on Canadian goods increased from 25% to 35% on August 1. Exemptions for USMCA-compliant goods and the previous tariff stacking order remain unchanged.
Calculate and analyze tariff impacts in real time with the Flexport Tariff Simulator.
Ocean
TRANS-PACIFIC EASTBOUND (TPEB)
- Capacity and Demand:
- Market demand in August is flat, with Southeast Asia ports continuing to post higher total loadings than China ports. In light of the 90-day extension of the temporary U.S.-China tariff agreement, no dramatic changes have been forecasted for September.
- According to recently released data from the Port of Los Angeles, the port’s July container volumes reached record levels: 1,019,837 TEUs in shipments processed, and 543,728,000 TEUs in imports. These numbers reflect months of tariff-related frontloading, which has resulted in an earlier peak season than normal this year. And since June, spot rates between Shanghai and the U.S. have seen a significant decline.
- Capacity remains at 70-80% of normal levels. Despite these reductions, the market is still experiencing overcapacity compared to overall demand, and space availability for shipments is open.
- Update on Section 301, Chinese-built vessels: Carriers have stated that vessel deployments are ongoing or complete, but no related surcharges have been announced.
- Equipment: Equipment availability has improved slightly since late July. Equipment shortages remain a primary concern for carriers like CMA and HMM, while other carriers are experiencing better conditions.
- Freight Rates: Freight rates for August were mitigated this week, given flat demand and the full removal of the Peak Season Surcharge (PSS) from the fixed market for the month of August.
FAR EAST WESTBOUND (FEWB)
- Capacity and Demand:
- Pressure on port of loading (POL) capacity has eased since July's peak levels. However, persistent vessel delays remain, given shipment departure slide-downs in response to previous congestion, shipment Changes of Vessels (COVs), and eastbound vessel arrival delays.
- Mid-to-late August shipments are now processing more smoothly with regard to space and equipment release.
- Extra loader vessels from Hapag-Lloyd and Maersk are open to book.
- Blank sailings remain limited, primarily affecting secondary services like CMA’s French Asia Line 7/FAL7 (long-transit Rotterdam) and CMA’s French Asia Line 8/FAL8 (Antwerp express).
- Freight Rates:
- Following last week's $90 decline in the Shanghai Containerized Freight Index (SCFI), most carriers are reducing Freight All Kinds (FAK) rates for the second half of August to stimulate demand.
- As the summer peak concludes, carriers are aiming to prevent a rapid rate collapse, with eastbound return efficiency still recovering.
- Another factor slowing rate drops are POL delays, which are prolonging backlog clearance. Rolling cargo is partially absorbing the increased capacity.
- FAK rates are anticipated to gradually soften through late August.
TRANS-ATLANTIC WESTBOUND (TAWB)
- Capacity and Demand:
- Antwerp remains heavily congested, at its worst since Covid-19, with dwell times exceeding nine days and yard utilization above 92%.
- Rotterdam, Hamburg, and Bremerhaven are continuing to see 85–88% yard utilization and vessel delays of three to five days.
- South Mediterranean ports (Piraeus, Genoa, Valencia) continue to experience wait times of three to six days, with no improvement from July levels.
- Low river levels on the Rhine and Danube, strikes in Germany, and rail disruptions in Central/Eastern Europe continue to strain inland logistics.
- Blank sailing rates are steady at ~5–6%. Capacity is stable, but some carriers are adjusting rotations to avoid bottlenecks.
- Equipment: Shortages continue in Austria, Slovakia, Hungary, Southern and Eastern Germany, and Portugal, particularly for 40’ HC and chassis. Turnaround times remain extended; no recovery in availability is expected before mid-Q3.
- Freight Rates:
- PSSs in North Europe and the West Mediterranean have been deferred until late Q3.
- The East Mediterranean (Turkey, Israel) expects to see a GRI in early September.
INDIAN SUBCONTINENT TO NORTH AMERICA
- Capacity and Demand:
- Capacity to the U.S. East Coast remains steady into the back half of August, with only two blank sailings announced across the month in total for the major Northwest India to U.S. East Coast corridor.
- Capacity to the U.S. West Coast is widely available, given the continued oversupply that has impacted major TPEB services that move cargo from the Indian subcontinent to the U.S. West Coast. Some feeder services are seeing high utilization on pockets that connect to main TPEB services.
- Freight Rates:
- Cargo moving to the U.S. East Coast: Rate levels are decreasing as we head into the second half of August. The market is seeing positive demand, but its impact on the balance of supply vs. demand is marginal.
- Cargo moving to the U.S. West Coast: Oversupply has drastically reduced rate levels in August.
- Exports from Pakistan continue to see elevated cost and transit times due to additional feeder services needed to service the country in light of the India-Pakistan conflict.
- As the additional 25% duty on India looms ahead on August 27, tariff impacts on demand and capacity remain extremely fluid. We expect to see cargo move as planned over the next two weeks, but after Week 35 is uncertain.
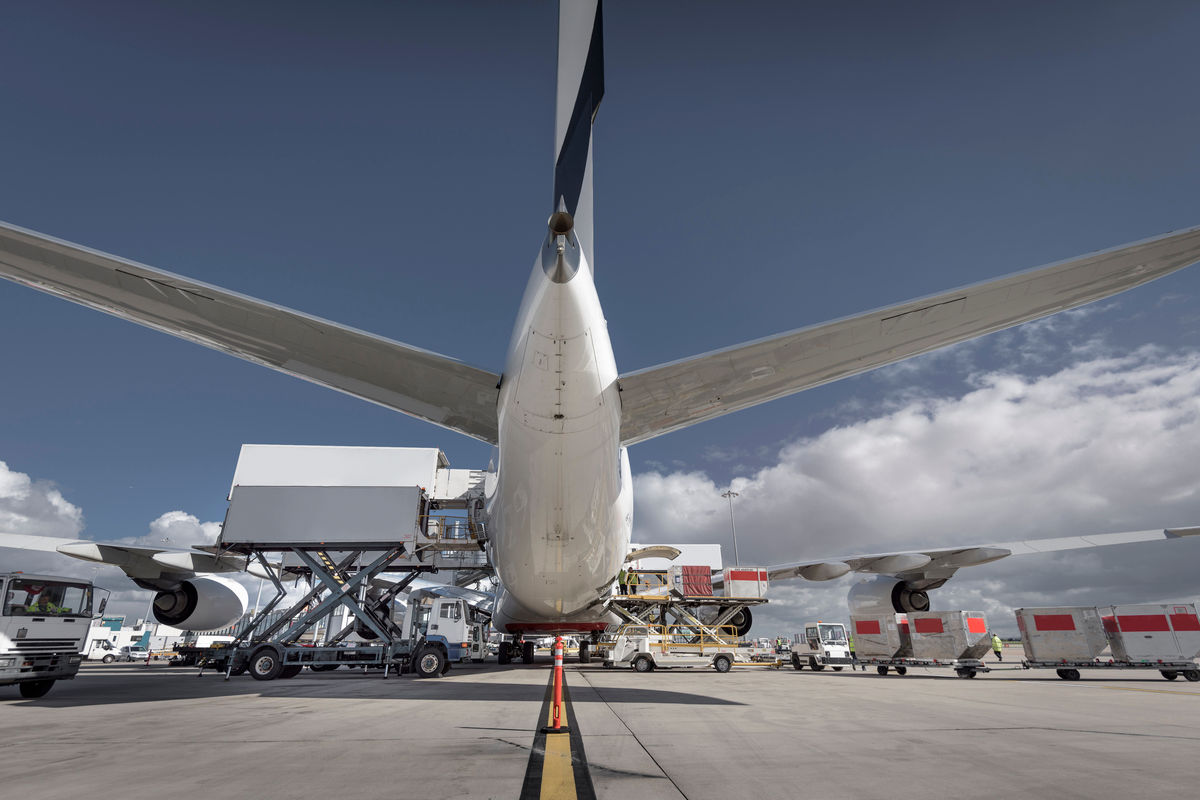
Air
- China and Hong Kong to the U.S.: Rates in Week 31 went up +2% WoW, but remained -15% down year over year. In Week 32 and this week (Week 33), the air freight market is facing a temporary capacity crunch due to volcanic ash from Russia's Klyuchevskoy volcano disrupting North Pacific routes. Airlines report 20-30% payload reductions and extended flight times over the weekend as aircrafts reroute around an ash cloud spanning 1,300+ nautical miles. Monday operations have largely returned to normal payload capacity, while the backlog from weekend disruptions are extending transit times in certain cases by two to three days. We anticipate full service normalization by the end of this week. Currently, rates remain stable, with slight potential increases due to temporary capacity constraints.
- South China: Both traditional and ecommerce demand have increased, pushing rates up in Week 32.
- Taiwan: Ahead of new tariffs that took effect on August 7, Taiwan’s electronics exporters accelerated shipments in Week 32, driving U.S. West Coast air freight rates above $10/kg for direct services. Volumes are expected to decline, and rates may soften. Space remains relatively tight due to backlogs from the pre-tariff surge. Current market levels in Week 33: U.S. West Coast at $5.50–8.50/kg, and U.S. East Coast at $7-9/kg.
- (Source: WorldACD and Flexport)
Please reach out to your account representative for details on any impacts to your shipments.
North America Vessel Dwell Times

Ocean Timeliness Indicator
Transit times from China to the U.S. West Coast and China to North Europe both experienced modest changes, while the route from China to the U.S. East Coast saw a notable reduction in transit time.
Week to August 11, 2025
Transit time from China to the U.S. West Coast increased by 0.2 days, rising from 34 to 34.2 days. The China to North Europe route saw a 1.3-day decrease, falling from 61.6 to 60.3 days. Meanwhile, the transit time from China to the U.S. East Coast decreased by 2.1 days, dropping from 56.9 to 54.8 days.

See the full report and read about our methodology here.
About the Author
Related content
![White House GettyImages-603224136 (1)]()
Blog
Live Updates: Trump Administration Tariffs, Trade Policy Changes, and Impacts on Global Supply Chains
![GettyImages-1411182583 1199x800]()
Blog
CBP’s Latest Guidance on Reporting Country of Smelt and Cast for Section 232 Aluminum Tariffs


更多
![WarehouseGettyImages-535667233]()
Global Logistics Update
U.S. and Taiwan Finalize Trade Deal; FEWB Spot Rates Soften Amid Lunar New Year Lull
![Ocean Port GettyImages-1083936322 (1)]()
Global Logistics Update
EU to Vote on Modified U.S. Trade Deal; Ex-Asia Demand Tapers Off Ahead of Lunar New Year
![Air GettyImages-1343405900]()
Global Logistics Update
U.S. to Cut Tariffs on India; TPEB and FEWB Carriers Plan Upcoming Blank Sailings