Global Logistics Update
Freight Market Update: April 4, 2023
Ocean and air freight rates and trends; customs and trade industry news plus Covid-19 impacts for the week of April 4, 2023.
Freight Market Update: April 4, 2023
Trends To Watch
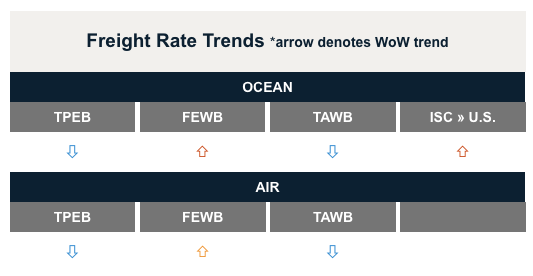
- [Ocean] On Transpacific Eastbound (TPEB), effective capacity remains at an oversupply with carriers continuing to announce more blank sailings in an attempt to reign in further rate drops. Meanwhile, the trends of shifting imports to the U.S. East Coast (USEC), as well as Canada & the Gulf, from the U.S. West Coast (USWC) continues to be seen in YoY volume data.
- [Ocean] Meanwhile, on Transatlantic Westbound (TAWB), rates continue their downward trend as demand is not recovering and capacity continues to increase. Expect this trend to continue for all Q2 2023 and beyond. Further, equipment is now widely available in all major European ports.
- [Air] A portion of Beijing Airport, the 3rd busiest in the country, is shut down for maintenance through the month of April. This is expected to remove approximately ⅓ of the facility's air cargo volume, or ~2.6% of China’s overall air cargo volume.
- [Air] Transatlantic routes are continuing to see increasing numbers of passenger flights being scheduled, thereby increasing belly capacity from Europe to N. America. This has brought capacity on these routes back to pre-COVID levels; however rates remain high due to fuel prices.
- [Trucking] The majority of US and Canadian ports and rail ramps are fluid, and not experiencing any significant delays—gulf ports are slightly congested but truck power is available nationwide and highway diesel rates remain stable.
Freight Rates
Expert Voices

Personal Consumption Eras and Restoring Stability Post-COVID
It’s easy to fall prey to the allure of month-to-month changes in key economic statistics. Markets do it with troubling regularity. Take real personal consumption expenditures (PCE). In February, PCE fell by just 0.1%; real disposable personal income (DPI) rose by just 0.2%. There are good reasons to focus on personal consumption, since in 2022 it accounted for 70.6% of U.S. real GDP.
That makes it all the more important to be cautious about reading much into these small monthly moves. First, they require context. Second, they are subject to revision. As an example of both, last month we were told that real PCE had risen by 1.1% in January. This month’s release revised that to 1.5%, meaning the newly-reported February drop was actually swamped by the January upward revision.

This week’s chart is an attempt to provide a longer-term perspective. It shows real PCE (black) and DPI (red) over the last five years, indexed to August 2021 (in levels, DPI is higher than PCE). It also breaks down PCE into goods and services sub-components. One could argue that there are three distinct eras:
- Pre-Covid (to February 2020)
- Covid Mayhem (March 2020-July 2021)
- Stability Restored (August 2021-present)
This is clearest for the PCE line, which is relatively smooth in Era 1, takes a sharp, craggy dip in Era 2, then seems to pick up where it left off in Era 3.
DPI, in contrast, spikes upward during the Covid Mayhem. It is relatively stable in the third Era, though it has a notable dip and recovery. While not in the chart, the personal savings rate has been steadily rising across this third era, from a low of 2.7% in June 2022 to 4.6% in the February release. Both DPI and the savings rate help indicate whether continued consumption is affordable.
The relative stability of the third era does not mean that everything is back to pre-Covid norms. Note that services consumption (the dashed line) has recovered its earlier levels, but does not appear to be back on its pre-Covid trend. Goods consumption emerged from the intense volatility of Covid Mayhem at a notably elevated level (without indexing, services consumption is substantially higher than goods consumption).
If we accept that this third era involves steadier growth in consumption, is that good or bad? While less frantic than the second era, it nevertheless raises some potential issues. First, real goods consumption rose at an 11.9% rate from March 2020 to July 2021, but only 1.3% since August 2021. The latter figure is positive, but dramatically lower. If a business had been planning for the rapid growth to continue, it could easily get caught with overflowing inventories.
Second, while the Covid Mayhem Era brought accelerating inflation, the third era has featured sufficiently strong consumption and growth that inflation has remained well above the 2% target level set by the Fed.
Working that inflation out of the economy may require yet a fourth era in which the economy slows notably.
-Phil Levy
For more details, like economic and political updates, please see the current Weekly Economic Report from the Flexport Research team, or subscribe to receive the latest updates right in your inbox every Monday.
Flexport Research Indicators
Flexport Consumption Forecast (FCF)
Southeast Asia Sectoral Cost Indices
Ocean Timeliness Indicator (OTI)
Upcoming Webinars
Flexport Platform Demo - North America
Weds, April 12 @ 12:00 pm PT / 3:00 pm ET
North America Freight Market Update Live
Thurs, April 13 @ 9:00 am PT / 12:00 pm ET
The State of Trade: Global Trade and the Environment
Tues, April 18 @ 9:00am PT / 12:00pm ET
The Week In News
A key inflation gauge tracked by the Fed slowed in February
The Consumer Price Index rose 0.3% in February, which is less than expected. Core inflation, which strips out food and energy prices, decreased to 5.5% from 5.6%, the lowest since late 2021. This is encouraging news for policymakers, as it indicates that inflation may be stabilizing after a period of rapid growth. According to Flexport’s Chief Economist Phil Levy, “You look at this report and think, we’ve got to keep applying the brakes.”
European Shippers Sign Up for Waterborne Biofuel Initiative
Seventeen European shippers, led by Dutch multimodal operator Samskip, have signed on to the “Switch to Zero” campaign by the Port of Rotterdam Authority and GoodShipping. The Renewable Energy Directive (RED II) mandates that 32% of all energy usage in the EU, including at least 14% of all energy in road and rail transport fuels, must come from renewable sources such as biofuels. Flexport also partners with GoodShipping to enable our customers to work toward carbon neutrality via the Impact Dashboard, part of the Flexport platform.
Read more news summaries like this in our weekly Supply Chain Snapshots
Read More on the Flexport Blog
Tariff Engineering: Lower Duties Are Possible if You Can Find the Right Customs Codes
Shipping to the EU? Here’s What You Need To Know About ICS2
Freight Market Update is a complimentary service from Flexport, the modern freight forwarder. If you're not already a subscriber, we invite you to subscribe here.
Please note that the information in our publications is compiled from a variety of sources based on the information we have to date. This information is provided to our community for informational purposes only, and we do not accept any liability or responsibility for reliance on the information contained herein.
更多
![Ocean Port GettyImages-865927856]()
Global Logistics Update
Some Aluminum Imports Soon to Face 200% Tariff; FEWB Demand and Rates Continue to Rise
![GettyImages-1410815558]()
Global Logistics Update
U.S. and U.K. Sign Trade Deal; FEWB Faces Congestion and Ongoing Capacity Tightness


